With Core Web Vitals upon us, people are scrambling to optimize their sites. Mostly a waste of time, but it is what it is.
Out of the 3 Core Web Vitals, cumulative layout shift (CLS) is the one I have seen people having the most trouble identifying. Obviously, seeing your score is easy in Pagespeed Insights, Lighthouse, or web.dev, but now how do you identify what is actually causing any shifts on your pages?
It’s pretty simple actually. To do so, you are going to want to use Chrome’s Web Developer Tools.
-Open the page you want to check in Chrome.
-Click the dropdown menu on Chrome.

-Go to More tools >> Developer tools
This should open you up into a screen that shows Lighthouse and a bunch of other options along a menu at the top.
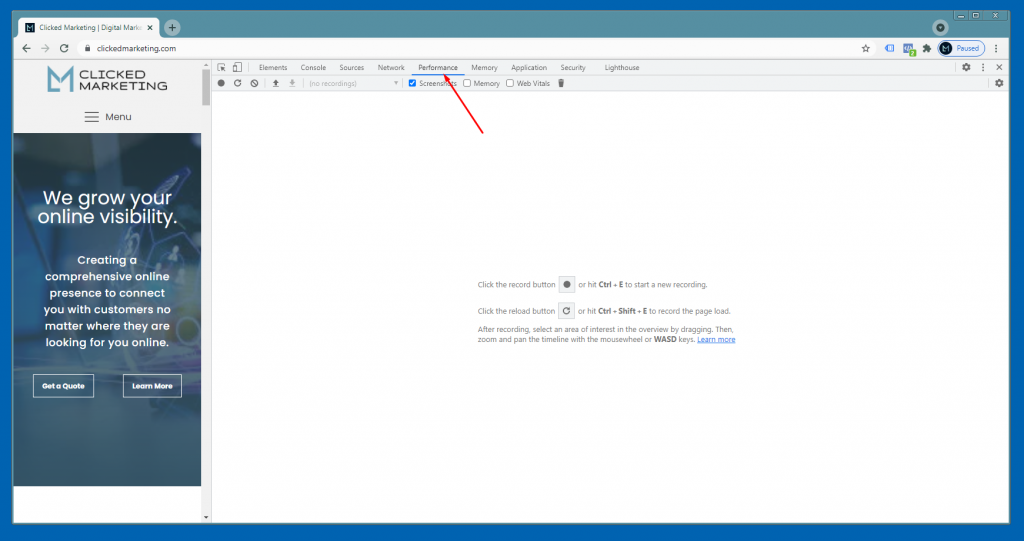
-Click on the Performance tab at the top.
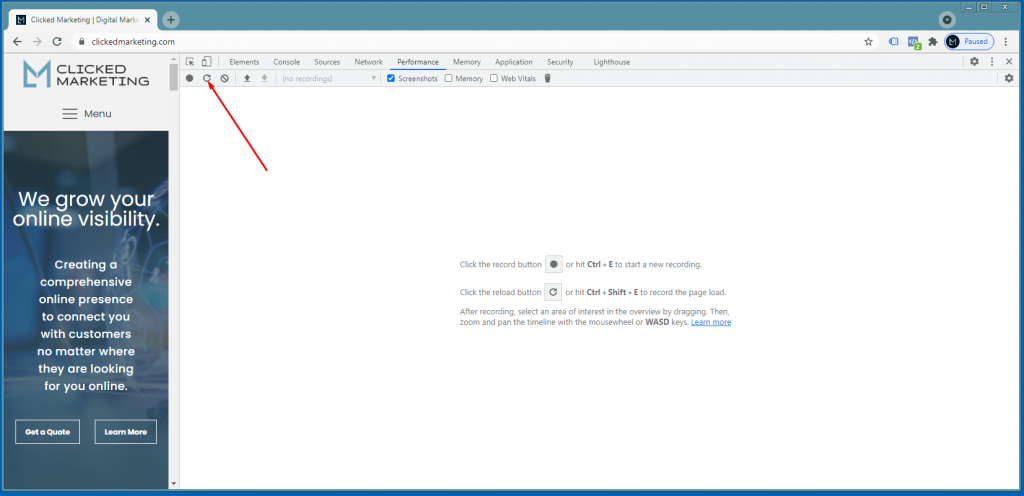
-Then click on what looks like a refresh icon.
-Let it load, and you will end up with something like the attached screenshot.
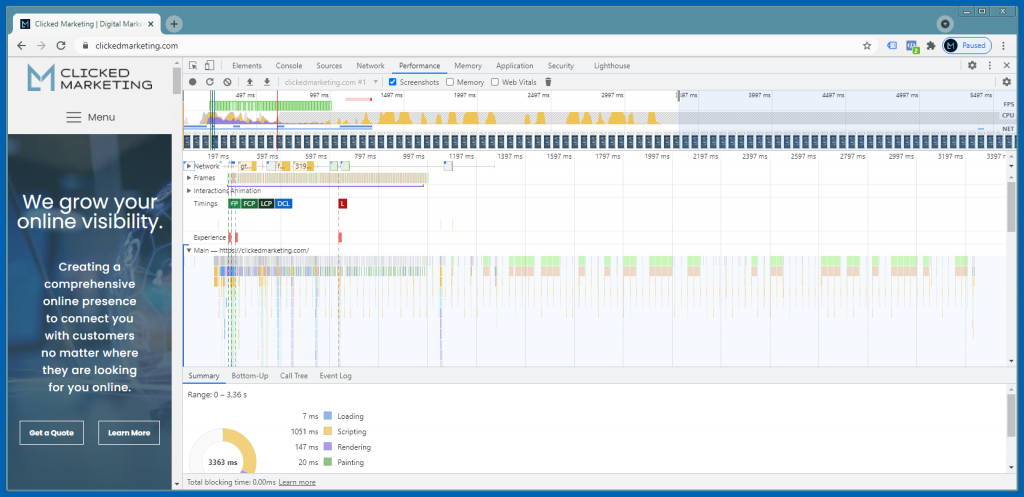
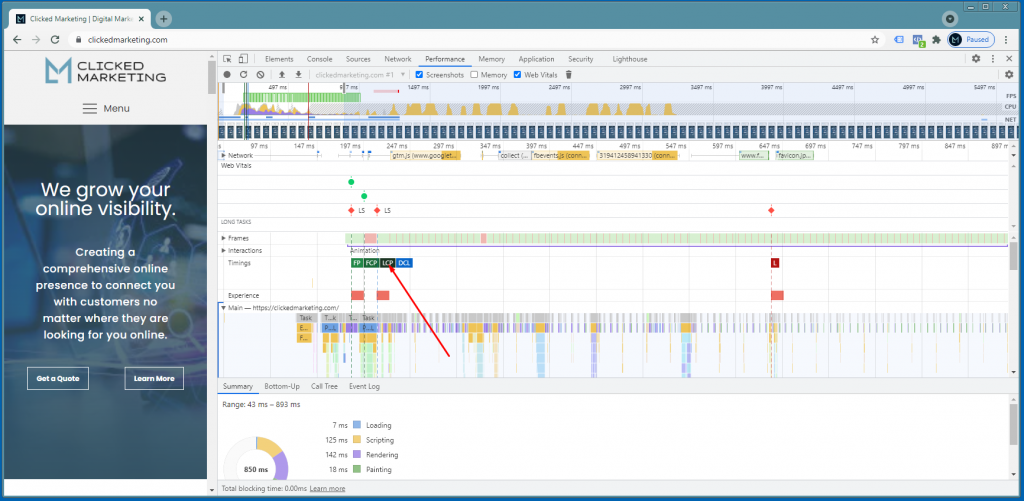
If you have cumulative layout shifts happening, they will appear as red bars under the Experience row. You can zoom in on them a little bit by hovering your mouse over that area and using the mouse scroll wheel. (At least on PC’s. I have no idea how to do it on inferior Mac machines.)
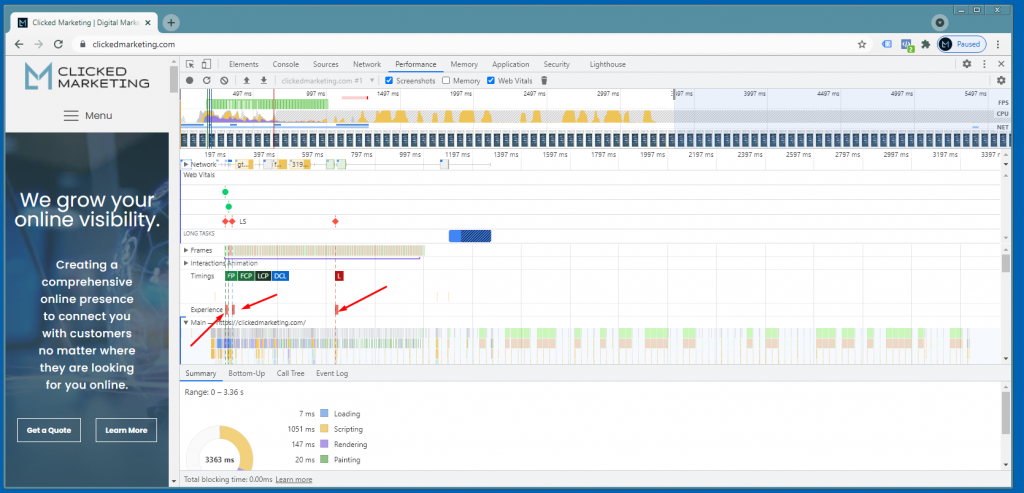
You can also click and drag the whole thing around if things start moving off the screen as you zoom in.
If you hover over the red bars, in the website pane on the left it will highlight where that shift is happening.
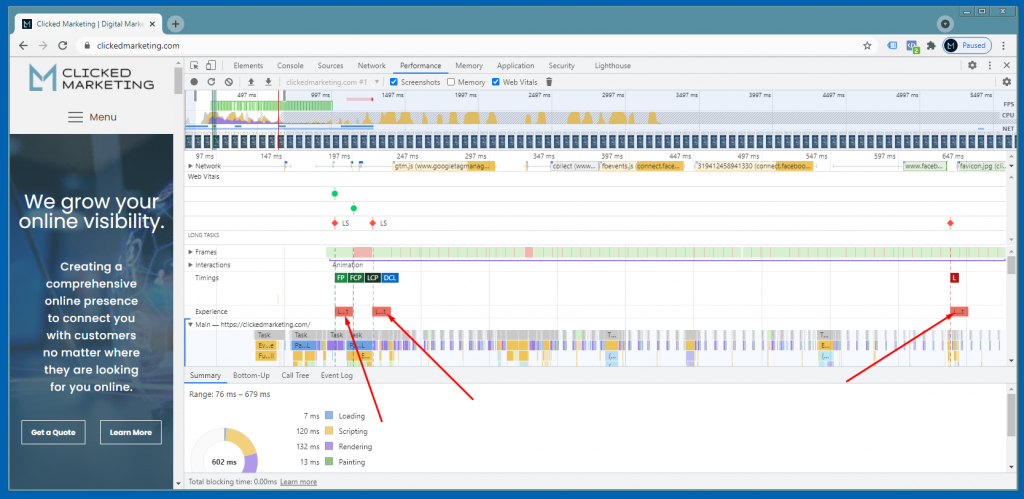
By the way, while you are here, you can also identify your Largest Contentful Pain (LCP) element as well. In the Timings row, you will see a black box labeled LCP. Hover over it and it will highlight your LCP element.
