Have you ever been hit with a traffic loss and are not sure where to start in identifying what happened? Did search queries lose rankings? Was there less search volume? Did those changes I made to title tags on a few pages hurt the CTR?
Of course Google Search Console contains comparison data that you can use to sort a date range versus another date range, but reading and analyzing data inside of Search Console is often slow and cumbersome, especially on larger and higher volume sites with lots of search queries involved.
You can grab a copy of this sheet at: https://theseopub.com/sheets/identifying-traffic-losses
Below I explain how to use it. There is also a video explanation linked at the bottom.
I created this sheet so you can more efficiently analyze what Search Console spits out, and it is super easy to use.
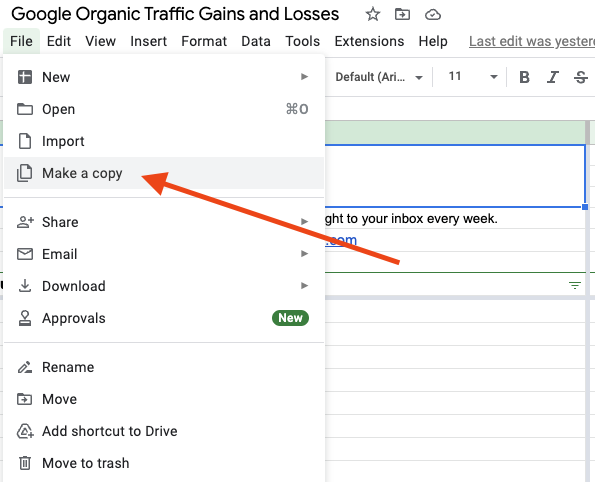
The first thing you want to do is make your own copy of the sheet. Go to File >>> Make a Copy.
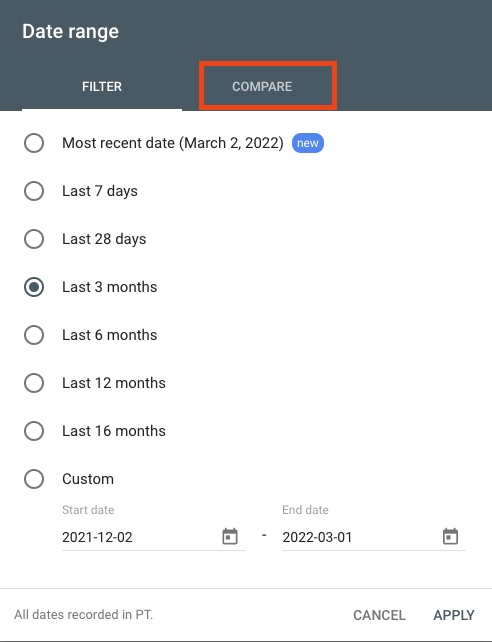
Next, select the comparison data you want to inspect from Google Search Console. You can use one of the preset options such as the past 28 days, past 3 months, past 28 days versus the past 28 days year over year, or you can create a custom date range. The sheet will work no matter what you select.
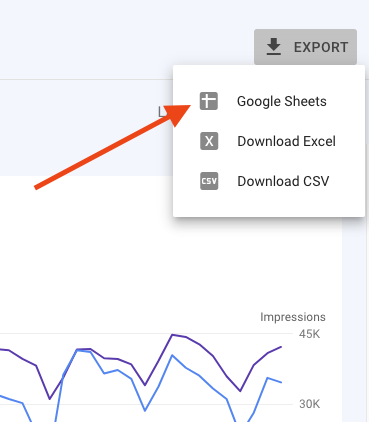
Then export the data into a Google Sheet.
Once the data has exported, you want to select all and copy everything on the Queries tab.
Go to the Google Sheet I shared, select the tab at the bottom that is named ‘ImportData-Queries’.

Make sure you have cell A1 selected and paste everything you copied from the export.
Then go back to the export data sheet and select all and copy everything on the Pages tab.

Go back to the sheet I shared and paste all of this into the tab labeled ‘ImportData-Pages’.
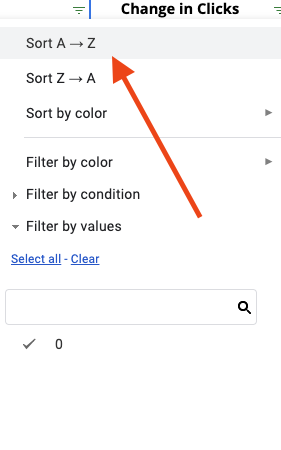
Now you can go to the Query Analysis and Page Analysis tabs and see all the data sorted nicely for you. It highlights click, impression, position, and CTR losses in red. The columns above also have filters for sorting data. If you want to sort by search queries that lost the most clicks, you can do that.
You can do the same thing with the Page Analysis tab, but this tab sorts your data by page, not query. You can see pages that lost traffic or impressions, etc.
Again, you can grab your own copy of the sheet at: theseopub.com/sheets/identifying-traffic-losses
Here is the video version of how to use this sheet: https://youtu.be/pPddmSfmwZY